
Excel Secondary Response Spectra
I’ve created two **Excel functions **that are useful for seismic analysis. One function calculates secondary response spectra from an acceleration time history; the other function calculates the time history response of a single degree of freedom (SDOF) oscillator to arbitrary base excitation.
Methodology for Calculating Excel Secondary Response Spectra
The method that has been implemented in Excel to calculating the SDOF response and secondary response spectra is from Dynamics of Structures (Anil K. Chopra) (Section 5.1 – Methods Based on Interpolation of Excitation).
The acceleration time history can be arbitrary (i.e. the method is not limited to sinusoidal inputs etc), but the input motion must have a constant time step.
Excel Secondary Response Spectra Function
Here is the function for calculating secondary response spectra in Excel:
Function SRSFunction(ByVal timerange As Range, ByVal accelrange As Range, my_damping As Double, my_time_increment As Double, my_freq As Double, my_out As Integer)

Dim timearray, accelarray As Variant
timearray = timerange.Value
accelarray = accelrange.Value

‘Calculate parameters
Dim my_omega, my_Wd, my_beta, my_Au, my_Bu, my_Cu, my_Du, my_Av, my_Bv, my_Cv, my_Dv As Double
Dim my_rows, i As Integer

my_omega = 2 * WorksheetFunction.Pi * my_freq
my_Wd = my_omega * ((1 – (my_damping / 100) ^ 2) ^ 0.5)
my_beta = my_omega * my_damping / 100
my_Au = 1 / (my_omega ^ 2 * my_Wd * my_time_increment) * (Exp(-my_beta * my_time_increment) * (((my_Wd ^ 2 – my_beta ^ 2) / my_omega ^ 2 – my_beta * my_time_increment) * Sin(my_Wd * my_time_increment) – ((2 * my_Wd * my_beta / my_omega ^ 2 + my_Wd * my_time_increment) * Cos(my_Wd * my_time_increment))) + 2 * my_Wd * my_beta / my_omega ^ 2)
my_Bu = 1 / (my_omega ^ 2 * my_Wd * my_time_increment) * (Exp(-my_beta * my_time_increment) * (-(my_Wd ^ 2 – my_beta ^ 2) / my_omega ^ 2 * Sin(my_Wd * my_time_increment) + (2 * my_Wd * my_beta / my_omega ^ 2 * Cos(my_Wd * my_time_increment))) + my_Wd * my_time_increment – 2 * my_Wd * my_beta / my_omega ^ 2)
my_Cu = (Exp(-my_beta * my_time_increment) * (Cos(my_Wd * my_time_increment) + my_beta / my_Wd * Sin(my_Wd * my_time_increment)))
my_Du = (1 / my_Wd) * (Exp(-my_beta * my_time_increment) * Sin(my_Wd * my_time_increment))
my_Av = 1 / (my_omega ^ 2 * my_Wd * my_time_increment) * (Exp(-my_beta * my_time_increment) * ((my_beta + my_omega ^ 2 * my_time_increment) * Sin(my_Wd * my_time_increment) + (my_Wd * Cos(my_Wd * my_time_increment))) – my_Wd)
my_Bv = 1 / (my_omega ^ 2 * my_Wd * my_time_increment) * (-Exp(-my_beta * my_time_increment) * (my_beta * Sin(my_Wd * my_time_increment) + (my_Wd * Cos(my_Wd * my_time_increment))) + my_Wd)
my_Cv = -(my_omega ^ 2 / my_Wd) * (Exp(-my_beta * my_time_increment) * Sin(my_Wd * my_time_increment))
my_Dv = (Exp(-my_beta * my_time_increment) * (Cos(my_Wd * my_time_increment) – my_beta / my_Wd * Sin(my_Wd * my_time_increment)))

my_rows = UBound(timearray, 1)

Dim maxU() As Double
Dim maxV() As Double
Dim maxA() As Double
Dim maxU2() As Double
Dim maxV2() As Double
Dim maxA2() As Double

ReDim maxU(1 To my_rows)
ReDim maxV(1 To my_rows)
ReDim maxA(1 To my_rows)
ReDim maxU2(1 To my_rows)
ReDim maxV2(1 To my_rows)
ReDim maxA2(1 To my_rows)

‘At time = zero, set to zero
maxU(1) = 0
maxV(1) = 0
maxA(1) = 0
maxU2(1) = 0
maxV2(1) = 0
maxA2(1) = 0

‘now loop for remainer
For i = 2 To my_rows
maxU(i) = my_Au * accelarray(i – 1, 1) + my_Bu * accelarray(i, 1) + my_Cu * maxU(i – 1) + my_Du * maxV(i – 1)
maxV(i) = my_Av * accelarray(i – 1, 1) + my_Bv * accelarray(i, 1) + my_Cv * maxU(i – 1) + my_Dv * maxV(i – 1)
maxA(i) = 2 * my_beta * maxV(i – 1) + (my_omega ^ 2) * maxU(i – 1)
If maxU2(i – 1) < Abs(maxU(i)) Then
maxU2(i) = Abs(maxU(i))
Else
maxU2(i) = maxU2(i – 1)
End If
If maxV2(i – 1) < Abs(maxV(i)) Then
maxV2(i) = Abs(maxV(i))
Else
maxV2(i) = maxV2(i – 1)
End If
If maxA2(i – 1) < Abs(maxA(i)) Then
maxA2(i) = Abs(maxA(i))
Else
maxA2(i) = maxA2(i – 1)
End If

Next i

If my_out = 1 Then
SRSFunction = maxU2(my_rows)
ElseIf my_out = 2 Then
SRSFunction = maxV2(my_rows)
ElseIf my_out = 3 Then
SRSFunction = maxA2(my_rows)
End If

End Function
To use the function you’ll need to add it to a module in VBA (Alt+F11). Here is a description of the function input parameters to type in a cell in the spreadsheet:
=``**SRSFunction**``(time range, acceleration range, damping ratio, time increment, frequency, output option)
Where:
- time range is the Excel range containing the time data (0 to 20 seconds say)
- acceleration range is the Excel range containing the acceleration data (data points corresponding to the times above)
- damping ratio is the percentage critical damping ratio, in percent
- time increment is the constant time step, for example 0.005 seconds
- frequency at which you want to calculate the secondary response. To generate a full SRS plot, you’ll want frequency points from say 0.1 Hz to 100 Hz, in sufficiently refined increments to capture the response at dominant frequencies
- output option can be 1, 2 or 3 for displacement, velocity or acceleration response spectra
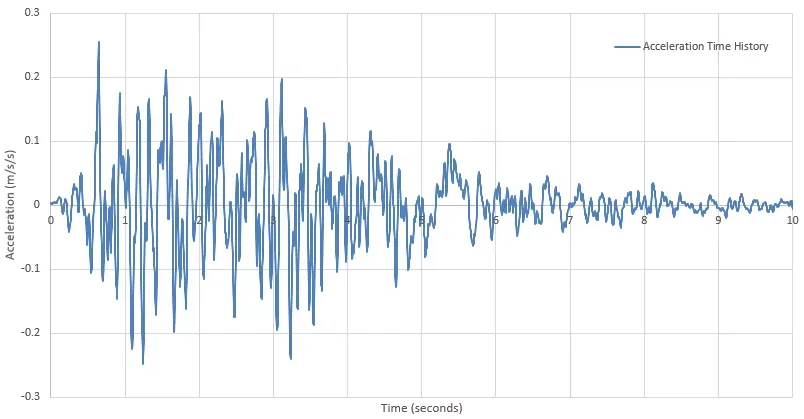
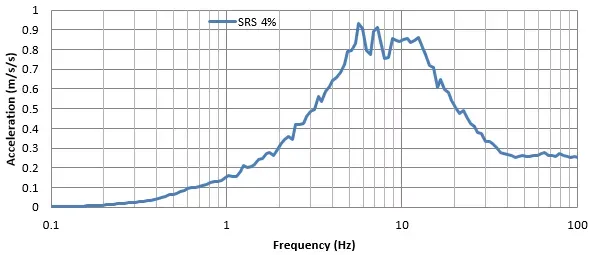
So given an acceleration time history, we can generate secondary response spectra. An example input base excitation is shown below, along with the calculated response spectrum at 4% damping.
Excel SDOF Response Function
Here is the function for calculating the response of a single degree of freedom oscillator in Excel:
Function SDOFResponse(ByVal timerange As Range, ByVal accelrange As Range, my_damping As Double, my_time_increment As Double, my_freq As Double, my_time As Double, my_out As Integer)

Dim timearray, accelarray As Variant
timearray = timerange.Value
accelarray = accelrange.Value

‘Calculate parameters
Dim my_omega, my_Wd, my_beta, my_Au, my_Bu, my_Cu, my_Du, my_Av, my_Bv, my_Cv, my_Dv As Double
Dim my_rows, i As Integer

my_omega = 2 * WorksheetFunction.Pi * my_freq
my_Wd = my_omega * ((1 – (my_damping / 100) ^ 2) ^ 0.5)
my_beta = my_omega * my_damping / 100
my_Au = 1 / (my_omega ^ 2 * my_Wd * my_time_increment) * (Exp(-my_beta * my_time_increment) * (((my_Wd ^ 2 – my_beta ^ 2) / my_omega ^ 2 – my_beta * my_time_increment) * Sin(my_Wd * my_time_increment) – ((2 * my_Wd * my_beta / my_omega ^ 2 + my_Wd * my_time_increment) * Cos(my_Wd * my_time_increment))) + 2 * my_Wd * my_beta / my_omega ^ 2)
my_Bu = 1 / (my_omega ^ 2 * my_Wd * my_time_increment) * (Exp(-my_beta * my_time_increment) * (-(my_Wd ^ 2 – my_beta ^ 2) / my_omega ^ 2 * Sin(my_Wd * my_time_increment) + (2 * my_Wd * my_beta / my_omega ^ 2 * Cos(my_Wd * my_time_increment))) + my_Wd * my_time_increment – 2 * my_Wd * my_beta / my_omega ^ 2)
my_Cu = (Exp(-my_beta * my_time_increment) * (Cos(my_Wd * my_time_increment) + my_beta / my_Wd * Sin(my_Wd * my_time_increment)))
my_Du = (1 / my_Wd) * (Exp(-my_beta * my_time_increment) * Sin(my_Wd * my_time_increment))
my_Av = 1 / (my_omega ^ 2 * my_Wd * my_time_increment) * (Exp(-my_beta * my_time_increment) * ((my_beta + my_omega ^ 2 * my_time_increment) * Sin(my_Wd * my_time_increment) + (my_Wd * Cos(my_Wd * my_time_increment))) – my_Wd)
my_Bv = 1 / (my_omega ^ 2 * my_Wd * my_time_increment) * (-Exp(-my_beta * my_time_increment) * (my_beta * Sin(my_Wd * my_time_increment) + (my_Wd * Cos(my_Wd * my_time_increment))) + my_Wd)
my_Cv = -(my_omega ^ 2 / my_Wd) * (Exp(-my_beta * my_time_increment) * Sin(my_Wd * my_time_increment))
my_Dv = (Exp(-my_beta * my_time_increment) * (Cos(my_Wd * my_time_increment) – my_beta / my_Wd * Sin(my_Wd * my_time_increment)))

my_rows = UBound(timearray, 1)

Dim maxU() As Double
Dim maxV() As Double
Dim maxA() As Double
Dim maxU2() As Double
Dim maxV2() As Double
Dim maxA2() As Double

ReDim maxU(1 To my_rows)
ReDim maxV(1 To my_rows)
ReDim maxA(1 To my_rows)
ReDim maxU2(1 To my_rows)
ReDim maxV2(1 To my_rows)
ReDim maxA2(1 To my_rows)

‘At time = zero, set to zero
maxU(1) = 0
maxV(1) = 0
maxA(1) = 0
maxU2(1) = 0
maxV2(1) = 0
maxA2(1) = 0

‘now loop for remainer
For i = 2 To my_rows
maxU(i) = my_Au * accelarray(i – 1, 1) + my_Bu * accelarray(i, 1) + my_Cu * maxU(i – 1) + my_Du * maxV(i – 1)
maxV(i) = my_Av * accelarray(i – 1, 1) + my_Bv * accelarray(i, 1) + my_Cv * maxU(i – 1) + my_Dv * maxV(i – 1)
maxA(i) = 2 * my_beta * maxV(i – 1) + (my_omega ^ 2) * maxU(i – 1)
If maxU2(i – 1) < Abs(maxU(i)) Then
maxU2(i) = Abs(maxU(i))
Else
maxU2(i) = maxU2(i – 1)
End If
If maxV2(i – 1) < Abs(maxV(i)) Then
maxV2(i) = Abs(maxV(i))
Else
maxV2(i) = maxV2(i – 1)
End If
If maxA2(i – 1) < Abs(maxA(i)) Then
maxA2(i) = Abs(maxA(i))
Else
maxA2(i) = maxA2(i – 1)
End If

Next i

If my_out = 1 Then
SDOFResponse = maxU((my_time / my_time_increment) + 1)
ElseIf my_out = 2 Then
SDOFResponse = maxV((my_time / my_time_increment) + 1)
ElseIf my_out = 3 Then
SDOFResponse = maxA((my_time / my_time_increment) + 1)
End If

End Function
Here is a description of the function input parameters:
=``**SDOFResponse**``(time range, acceleration range, damping ratio, time increment, frequency, time, output option)
Where:
- time range is the Excel range containing the time data (0 to 20 seconds say)
- acceleration range is the Excel range containing the acceleration data (data points corresponding to the times above)
- damping ratio is the percentage critical damping ratio, in percent
- time increment is the constant time step, for example 0.005 seconds
- frequency of the SDOF oscillator, calculated as:
- **time **at which you want to calculate the SDOF response. To generate a full response time history, you’ll want time points from say 0 to 20 seconds, and this must match the time points from the time range input
- output option can be 1, 2 or 3 for displacement, velocity or acceleration SDOF response
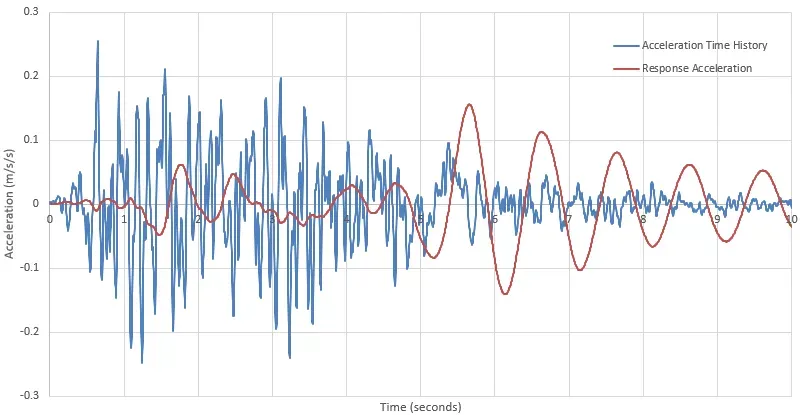
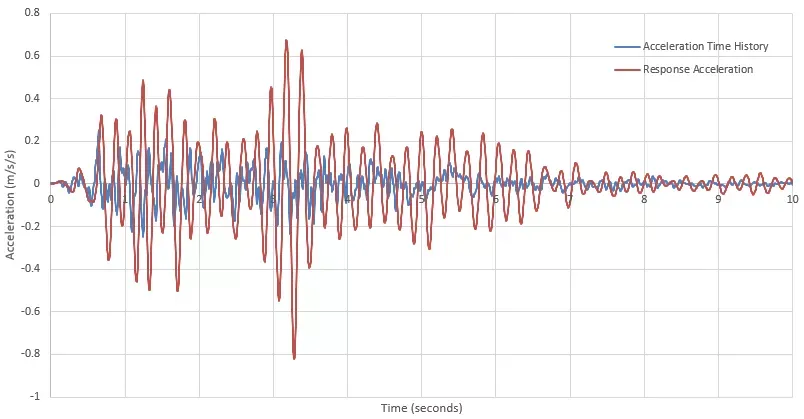
So given an acceleration time history and an oscillator with a given frequency, we can calculate the SDOF response time history. Two examples are given below, one with a 1Hz oscillator and one with a 5Hz oscillator.
These functions have only been self-checked, so do your own verification before using the results.
Download Excel Secondary Response Spectra Example Spreadsheet
The link to the attached spreadsheet below contains the two functions discussed above, with examples to show you how best to use the functions.