
Automated Workflow Report
Previously I posted about creating an automated analysis workflow using the concept of a Directed Acyclic Graph (DAG). This is implemented using the Python package snakemake. The previous post on creating an analysis workflow can be found Snakemake Analysis Workflow Management.
This concept can be extended further by including an automated workflow report as part of the workflow. Writing a report is already implemented in snakemake, the benefit here to engineering simulation is that generally the output an analysis workflow is the collation and summarising of analysis results. Automating this means the entire workflow, from the analyses to the final report, is reproducible, plus provenance of the results presented in the report is ensured. This is a huge step forward, and eliminates the tedious and error-prone copy-pasting into Word documents that is the useful end point of finite element analyses.
The image below is an example of a simple automated workflow report. It can include graphics (in the case below the entire DAG is printed), text, mathematical expressions, etc. The report is in html format. The goal should be to encapsulate the entire workflow process as a DAG, so that all dependencies are explicitly captured and everything is automated. Whilst my focus is on applying this to engineering simulation, this approach could also apply to “traditional” engineering such as code assessments and other forms of hand calculations. Anything that has dependencies (results, masses, parameters, material properties, …) and that processes results in a way that would benefit from removing manual interaction is a prime candidate for improvement. If the entire workflow is automated, including the final report, then if an error is found or a parameter in the analysis needs updating, then one change is all that is needed to reproduce the entirety of the work. Compare this to how long it would take to change (say) a material property in a number of analyses, rerun manually, extract results manually, combine results to give a summary, and finally copy and paste model screenshots, result summaries etc to a final report…!
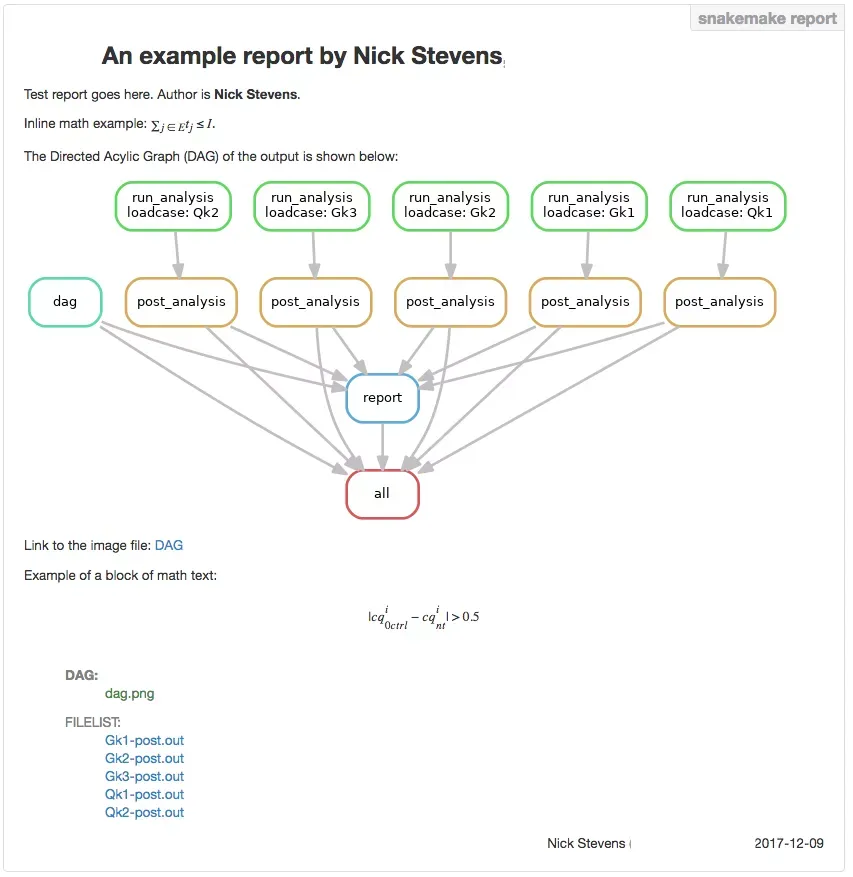
Automated Analysis Report
So just to reiterate; the image above is a screenshot of a completely automated report that just happens to be the final step in a chain of processes representative of an actual engineering simulation workflow. There is some overhead in setting up a workflow like this, but how many times have you gone from start to finish in an analysis without once have to repeat something? It would also be fair to say that there is no guaranteed way of ensuring the provenance of every single piece of data in a report. I.e. can you be 100% sure that every screenshot, number, etc is from the latest analysis? Eliminating the manual element of engineering simulation and the clear provenance of data are the two main reasons for adopting a workflow approach like this.
I’ve also been working on a more complete option for the technical report using RMarkdown; this has the added benefit that you as well as a html report you can also produce a PDF, and even a Microsoft Word document, but with an added dose of reproducibility! I intend to use this in a project later this year.