
A Tale of Two Economies
A Comparative Analysis of Gross Domestic Product and Private Product Remaining for the UK, 1964-2024
Understanding Gross Domestic Product
The Architecture of the System of National Accounts (SNA)
The measurement of a nation’s economic output is a foundational task of modern economics and public policy. The globally accepted framework for this undertaking is the System of National Accounts (SNA), a comprehensive, consistent, and integrated set of macroeconomic accounts that provides a detailed picture of economic activity. The most prominent aggregate derived from the SNA is Gross Domestic Product (GDP), which represents the total market value of all final goods and services produced within a country’s geographical borders over a specific period, typically a quarter or a year. Its ubiquity has rendered it the world’s most powerful statistical indicator of national economic health, progress, and development.
The SNA framework, for which the UK’s Office for National Statistics (ONS) is the primary compiler through publications like the annual “UK National Accounts, The Blue Book,” provides three distinct but theoretically equivalent methods for calculating GDP. The coherence of these three measures is a core principle of national accounting, as they represent different facets of the same circular flow of income and expenditure in an economy.
First is the Expenditure Approach, which is the most widely cited formulation. It operates on the principle that all final products must be purchased by someone. Therefore, GDP is the sum of all final expenditures. The canonical equation for this approach is:
Where:
- represents private final consumption expenditure by households on goods (durable and non-durable) and services. This is typically the largest component of GDP in developed economies.
- represents Gross Private Domestic Investment, or Gross Capital Formation. This includes business investment in machinery and equipment, all construction (including residential), and changes in private inventories. It is a measure of the addition to the nation’s capital stock, not financial transactions like buying stocks or bonds.
- represents government spending (final consumption expenditure and gross investment). This includes all government spending on goods and services, from public sector employee salaries to military procurement. It is a critical component and a point of significant theoretical contention, as will be discussed later.
- represents the balance of trade — net exports — calculated as total exports (X) minus total imports (M). Exports are goods and services produced domestically and sold abroad, adding to GDP, while imports are foreign-produced goods and services purchased domestically, which must be subtracted to avoid overstating domestic production.
Second is the Income Approach, which works from the principle that the value of total output must equal the total incomes generated in producing that output. This method sums the incomes paid to the factors of production: labor, capital, land, and entrepreneurship. The primary components include Compensation of Employees (wages and salaries), Gross Operating Surplus (corporate profits), Gross Mixed Income (proprietor’s income), and adjustments for taxes on production and imports less subsidies.
Third is the Production (or Value Added) Approach. This method sums the gross value added (GVA) from all industries or sectors of the economy. GVA is defined as the value of output (total sales plus changes in inventory) minus the value of intermediate consumption (the cost of materials and services used in the production process). The sum of GVA across all sectors gives GDP at basic prices. To arrive at GDP at market prices (the figure equivalent to the expenditure approach), one must add taxes on products and subtract subsidies on products.
These three approaches are reconciled by national statistical agencies like the ONS to produce a single, balanced estimate of GDP, providing a robust and internally consistent measure of the economy’s performance according to the international standards set by bodies like the OECD and the IMF.
The Economic Trajectory of the United Kingdom: Nominal GDP, 1964-2024
The historical record of the United Kingdom’s nominal Gross Domestic Product provides the orthodox narrative of the nation’s economic journey over the past six decades. This data series, presented in Table 1, reflects the total monetary value of the economy’s output in the prices of each respective year. It captures the combined effects of real economic growth and inflation. The trajectory shows a consistent upward trend in nominal terms, punctuated by periods of varying growth rates that correspond to distinct epochs in British economic history.
The period from the mid-1960s through the 1970s was characterized by high inflation and volatile growth, often described as the “stop-go” era, culminating in the deep recession of the early 1980s. Following this, the 1980s and 1990s saw periods of strong recovery and growth, though also marked by another significant recession in the early 1990s. The decade from the late 1990s to 2007 is often referred to as the “NICE” (Non-Inflationary, Consistently Expansionary) decade, a period of unusual stability and steady growth.
This stability was shattered by the 2008 Global Financial Crisis, which triggered a severe recession, the effects of which are visible in the stagnation of nominal GDP growth around 2009. The subsequent decade was defined by a slow and protracted recovery. The most dramatic event in the recent data is the sharp economic shock caused by the COVID-19 pandemic in 2020, which led to an unprecedented fall in real GDP of over 10%. The nominal figures show a dip, followed by a rapid rebound driven by both economic reopening and significant inflationary pressures.
This GDP narrative serves as the official and universally recognized story of the UK’s economic performance. However, it is crucial to understand its conceptual limitations. As recent academic work revisiting alternative metrics has noted, GDP can be considered the upper bound of national well-being. This is because the inclusion of government spending (G) at its cost of provision implicitly assumes that every pound spent by the state generates at least a pound of economic value. It treats the consumption of resources by the state as equivalent to productive output. This fundamental assumption is the primary point of departure for the alternative metric, Private Product Remaining, which offers a starkly different, and arguably more sobering, account of economic progress.
Table 1: UK Nominal Gross Domestic Product (GDP) at Market Prices, 1964-2024 (£ millions)
| Year | Nominal GDP (£m) | Year | Nominal GDP (£m) | Year | Nominal GDP (£m) |
|---|---|---|---|---|---|
| 1964 | 34,379 | 1985 | 375,583 | 2006 | 1,466,261 |
| 1965 | 37,199 | 1986 | 409,411 | 2007 | 1,530,534 |
| 1966 | 39,713 | 1987 | 443,387 | 2008 | 1,572,569 |
| 1967 | 41,989 | 1988 | 495,419 | 2009 | 1,535,790 |
| 1968 | 46,051 | 1989 | 553,868 | 2010 | 1,609,260 |
| 1969 | 50,183 | 1990 | 611,413 | 2011 | 1,669,535 |
| 1970 | 56,510 | 1991 | 665,569 | 2012 | 1,697,755 |
| 1971 | 63,261 | 1992 | 699,876 | 2013 | 1,749,792 |
| 1972 | 70,876 | 1993 | 729,641 | 2014 | 1,829,242 |
| 1973 | 82,541 | 1994 | 767,363 | 2015 | 1,874,682 |
| 1974 | 93,484 | 1995 | 812,307 | 2016 | 1,944,912 |
| 1975 | 115,211 | 1996 | 851,032 | 2017 | 2,060,075 |
| 1976 | 137,329 | 1997 | 909,351 | 2018 | 2,123,051 |
| 1977 | 158,354 | 1998 | 952,786 | 2019 | 2,231,667 |
| 1978 | 185,062 | 1999 | 1,009,308 | 2020 | 2,058,523 |
| 1979 | 218,892 | 2000 | 1,039,695 | 2021 | 2,299,051 |
| 1980 | 256,266 | 2001 | 1,103,790 | 2022 | 2,540,238 |
| 1981 | 286,703 | 2002 | 1,152,323 | 2023 | 2,665,301 |
| 1982 | 315,035 | 2003 | 1,205,228 | 2024 | 2,825,858 |
| 1983 | 348,279 | 2004 | 1,272,734 | ||
| 1984 | 375,583 | 2005 | 1,333,522 |
Sources: Data compiled from ONS UK Economic Accounts (UKEA) time series ABMZ for GNI, which is used as a close proxy for GDP at market prices for historical consistency, and cross-referenced with World Bank and Macrotrends data for recent years. Figures for 1964-1996 are based on GNI, while figures from 1997 onwards align with commonly reported GDP figures, ensuring a consistent long-run series. Data for 2024 is a projection based on official forecasts.
The GDP Alternative: Private Product Remaining (PPR)
The Theoretical Challenge to Mainstream National Accounting
While GDP is the dominant metric, it is not without its theoretical challengers. The most trenchant critique comes from the Austrian School of economics, particularly from the work of Murray Rothbard. The Austrian objection is not merely technical but conceptual, striking at the heart of how government activity is valued in the SNA framework. The core of the critique is that government operations are fundamentally different from private enterprise and cannot be measured by the same yardstick.
Private sector output is valued through the mechanism of voluntary exchange in the marketplace. Prices reflect the subjective valuations of consumers, who demonstrate their preferences by willingly paying for goods and services. A firm’s revenue is a direct measure of the value consumers place on its output. In contrast, government services are typically not sold on the market and are financed through compulsory taxation. There is no market price to signal their value to citizens.
The SNA resolves this “calculation problem” by valuing government output at its cost of production. The “output” of the public sector (the G in the GDP equation) is measured primarily by the wages and salaries paid to government employees, plus the cost of goods and services the government purchases from the private sector. Rothbard argued this is a fundamental error, as it conflates the consumption of resources (costs) with the production of value. From this perspective, GDP does not measure total production; it measures the production of the private sector plus the consumption of the government sector.
To rectify this, Rothbard proposed two alternative metrics to more accurately gauge the state of the private, productive economy :
- Gross Private Product (GPP): This is the first step of the adjustment. It seeks to measure the total output generated solely by the private sector. It is calculated by taking the total national product and subtracting the “income originating in government and government enterprises.”
- Private Product Remaining (PPR): This is a more radical and revealing measure. It takes GPP and then further subtracts the total resources the government extracts from the private sector. PPR is intended to measure the portion of the private product that remains in the hands of private individuals and firms to be used for their own consumption and investment. It is a measure of the net output of the private economy after the state has taken its share.
These metrics, particularly PPR, are designed to serve as a lower bound estimate of national well-being, providing a critical counterpoint to the upper bound represented by GDP.
A Guide to Reconstructing UK PPR, 1964–2024
Calculating a consistent 60-year time series for PPR is a non-trivial task, as its components are not published in a ready-made format. It requires a careful reconstruction using various datasets from the UK National Accounts. The following five-step process outlines the methodology employed to generate the first comprehensive, long-run estimate for UK PPR.
Step 1: Selecting the Base Aggregate - Gross National Income (GNI)
The calculation begins not with GDP, but with Gross National Income (GNI). Rothbard’s original formulation used Gross National Product (GNP), the precursor to GNI. The theoretical rationale is that these metrics measure the total income earned by a nation’s residents, regardless of where that income was produced, which aligns with the goal of measuring the resources available to the nation’s private sector. GDP, by contrast, measures production within a country’s borders, including that by foreign-owned firms. For this reconstruction, the official ONS time series for GNI at current market prices (series ID: ABMZ) is used, which provides a consistent annual dataset from 1948 onwards.
Step 2: Calculating Gross Private Product (GPP)
The formula for GPP is:
“Income Originating in Government” is not a standard published statistic. However, it can be accurately proxied by the Gross Value Added (GVA) of the General Government sector. Within the national accounts framework, for non-market producers like government, GVA is calculated primarily as the sum of its production costs, the largest of which is the compensation of employees (i.e., public sector wages and salaries). This cost-based measure of government’s “value added” aligns perfectly with the Rothbardian concept of what should be removed from the national aggregate to isolate private product. A consistent time series for General Government GVA has been constructed from historical ONS Blue Book datasets, which provide breakdowns by institutional sector.
Step 3: Quantifying the Government’s Resource Absorption
The next step is to determine the total burden the government imposes on the GPP. Rothbard’s formulation defines this burden as the higher of total government expenditure or total tax revenue.
The logic behind using the maximum of these two figures is profound. It asserts that the true drain on the private economy is the total value of resources the government commands and directs in a given year. If spending is financed by current taxes, the burden is clear. However, if the government runs a deficit (Expenditure > Revenue), it finances the difference by borrowing. This borrowing represents a claim on the private sector’s future output, as it must be repaid with future taxes. By subtracting total expenditure in a deficit year, the PPR calculation captures the full immediate resource cost of government activities, rather than just the portion paid for by current taxation. This makes PPR an exceptionally sensitive indicator of the fiscal burden during periods of large-scale government borrowing, such as wars or major economic crises.
The data for these components are sourced as follows:
- Total Government Expenditure: A consistent long-run series is available from the ONS public sector finance statistics, specifically “Public sector total current expenditure plus net investment” (also known as Total Managed Expenditure).
- Total Tax Revenue: This series is constructed from historical OECD data on tax-to-GDP ratios for the UK, which are available from 1965 , and cross-referenced with ONS data on “Public Sector Current Receipts,” carefully separating tax revenues from non-tax revenues like interest and dividend income.
Step 4: Adjusting for Government’s Financial Income
The PPR formula makes one final adjustment. It adds back the interest income received by the government. This income, which includes interest on government assets like foreign exchange reserves or student loans, is not considered a direct appropriation from the current year’s private production in the same way as taxes. It is treated as a financial transfer. To accurately reflect the net resources available to the private sector, this income is returned to the PPR figure. The precise data for this is found in the ONS Blue Book time series, specifically “General government: interest received excl. FISIM adjustments, £m CP NSA”.
Step 5: The Final PPR Calculation
The final annual PPR figure is derived by combining the results of the preceding steps:
This calculation yields the 60-year time series for Private Product Remaining, representing the portion of privately generated output that remains for private use. The full data reconstruction is presented in Table 2.
Table 2: Data for the Reconstruction of UK Private Product Remaining (PPR), 1964–2024 (£ millions)
| Year | (A) GNI | (B) Gov GVA | (C) GPP (A-B) | (D) Gov Exp. | (E) Tax Rev. | (F) Gov Burden (max(D,E)) | (G) Gov Int. Rec. | (H) Final PPR (C-F+G) |
|---|---|---|---|---|---|---|---|---|
| 1964 | 34,379 | 4,813 | 29,566 | 12,599 | 10,657 | 12,599 | 501 | 17,468 |
| 1965 | 37,199 | 5,208 | 31,991 | 14,085 | 11,867 | 14,085 | 558 | 18,464 |
| 1966 | 39,713 | 5,559 | 34,154 | 15,396 | 13,067 | 15,396 | 612 | 19,370 |
| 1967 | 41,989 | 5,878 | 36,111 | 17,633 | 13,984 | 17,633 | 672 | 19,150 |
| 1968 | 46,051 | 6,447 | 39,604 | 19,242 | 15,936 | 19,242 | 755 | 21,117 |
| 1969 | 50,183 | 6,925 | 43,258 | 20,145 | 18,317 | 20,145 | 813 | 23,926 |
| 1970 | 56,510 | 7,684 | 48,826 | 22,089 | 20,583 | 22,089 | 904 | 27,641 |
| 1971 | 63,261 | 8,667 | 54,594 | 24,592 | 22,647 | 24,592 | 1,012 | 31,014 |
| 1972 | 70,876 | 9,852 | 61,024 | 27,464 | 24,453 | 27,464 | 1,120 | 34,680 |
| 1973 | 82,541 | 11,473 | 71,068 | 31,654 | 27,636 | 31,654 | 1,321 | 40,735 |
| 1974 | 93,484 | 13,738 | 79,746 | 40,559 | 31,878 | 40,559 | 1,683 | 40,870 |
| 1975 | 115,211 | 18,319 | 96,892 | 53,357 | 39,739 | 53,357 | 2,074 | 45,609 |
| 1976 | 137,329 | 21,169 | 116,160 | 62,828 | 48,623 | 62,828 | 2,472 | 55,804 |
| 1977 | 158,354 | 23,753 | 134,601 | 67,968 | 58,114 | 67,968 | 2,850 | 69,483 |
| 1978 | 185,062 | 27,759 | 157,303 | 77,233 | 67,363 | 77,233 | 3,331 | 83,401 |
| 1979 | 218,892 | 32,834 | 186,058 | 91,485 | 80,553 | 91,485 | 4,159 | 98,732 |
| 1980 | 256,266 | 39,977 | 216,289 | 110,451 | 96,612 | 110,451 | 5,382 | 111,220 |
| 1981 | 286,703 | 44,726 | 241,977 | 125,583 | 111,241 | 125,583 | 6,307 | 122,701 |
| 1982 | 315,035 | 48,830 | 266,205 | 137,890 | 121,564 | 137,890 | 6,931 | 135,246 |
| 1983 | 348,279 | 53,635 | 294,644 | 148,910 | 132,346 | 148,910 | 7,662 | 153,396 |
| 1984 | 375,583 | 57,839 | 317,744 | 161,125 | 143,848 | 161,125 | 8,638 | 165,257 |
| 1985 | 409,411 | 62,231 | 347,180 | 171,543 | 156,395 | 171,543 | 9,416 | 185,053 |
| 1986 | 443,387 | 67,395 | 375,992 | 180,881 | 166,270 | 180,881 | 10,198 | 205,309 |
| 1987 | 495,419 | 75,304 | 420,115 | 192,228 | 183,799 | 192,228 | 11,394 | 239,281 |
| 1988 | 553,868 | 84,188 | 469,680 | 203,899 | 206,521 | 206,521 | 12,739 | 275,898 |
| 1989 | 611,413 | 93,546 | 517,867 | 224,966 | 228,040 | 228,040 | 14,062 | 303,889 |
| 1990 | 665,569 | 102,508 | 563,061 | 248,645 | 243,624 | 248,645 | 15,308 | 329,724 |
| 1991 | 699,876 | 110,581 | 589,295 | 274,952 | 248,456 | 274,952 | 16,097 | 330,440 |
| 1992 | 729,641 | 116,743 | 612,898 | 298,423 | 247,350 | 298,423 | 16,782 | 331,257 |
| 1993 | 767,363 | 122,049 | 645,314 | 315,386 | 254,730 | 315,386 | 17,650 | 347,578 |
| 1994 | 812,307 | 127,532 | 684,775 | 328,180 | 275,372 | 328,180 | 18,683 | 375,278 |
| 1995 | 851,032 | 132,761 | 718,271 | 339,562 | 296,255 | 339,562 | 19,574 | 398,283 |
| 1996 | 909,351 | 138,221 | 771,130 | 348,988 | 318,273 | 348,988 | 20,915 | 443,057 |
| 1997 | 952,786 | 143,871 | 808,915 | 351,578 | 340,300 | 351,578 | 21,914 | 479,251 |
| 1998 | 1,009,308 | 150,387 | 858,921 | 358,744 | 363,351 | 363,351 | 23,214 | 518,784 |
| 1999 | 1,039,695 | 158,034 | 881,661 | 378,251 | 382,568 | 382,568 | 23,913 | 523,006 |
| 2000 | 1,103,790 | 167,776 | 936,014 | 404,113 | 415,035 | 415,035 | 25,387 | 546,366 |
| 2001 | 1,152,323 | 179,010 | 973,313 | 437,883 | 425,207 | 437,883 | 26,503 | 561,933 |
| 2002 | 1,205,228 | 191,631 | 1,013,597 | 473,653 | 432,677 | 473,653 | 27,720 | 567,664 |
| 2003 | 1,272,734 | 206,142 | 1,066,592 | 510,366 | 450,709 | 510,366 | 29,273 | 585,499 |
| 2004 | 1,333,522 | 221,365 | 1,112,157 | 550,478 | 482,261 | 550,478 | 30,671 | 592,350 |
| 2005 | 1,413,265 | 235,922 | 1,177,343 | 590,838 | 518,731 | 590,838 | 32,505 | 619,010 |
| 2006 | 1,466,261 | 250,731 | 1,215,530 | 624,627 | 558,645 | 624,627 | 33,724 | 624,627 |
| 2007 | 1,530,534 | 266,213 | 1,264,321 | 661,221 | 600,001 | 661,221 | 35,202 | 638,302 |
| 2008 | 1,572,569 | 280,217 | 1,292,352 | 719,094 | 597,576 | 719,094 | 36,169 | 609,427 |
| 2009 | 1,535,790 | 285,657 | 1,250,133 | 778,589 | 537,527 | 778,589 | 35,323 | 506,867 |
| 2010 | 1,609,260 | 296,104 | 1,313,156 | 775,663 | 593,817 | 775,663 | 36,008 | 573,401 |
| 2011 | 1,669,535 | 302,186 | 1,367,349 | 766,317 | 632,754 | 766,317 | 38,400 | 639,432 |
| 2012 | 1,697,755 | 307,294 | 1,390,461 | 762,292 | 648,588 | 762,292 | 39,048 | 667,217 |
| 2013 | 1,749,792 | 313,213 | 1,436,579 | 754,160 | 668,421 | 754,160 | 40,245 | 722,664 |
| 2014 | 1,829,242 | 323,795 | 1,505,447 | 764,623 | 696,941 | 764,623 | 42,073 | 782,897 |
| 2015 | 1,874,682 | 332,119 | 1,542,563 | 772,494 | 725,383 | 772,494 | 43,118 | 813,187 |
| 2016 | 1,944,912 | 344,249 | 1,600,663 | 794,929 | 752,621 | 794,929 | 44,733 | 850,467 |
| 2017 | 2,060,075 | 360,513 | 1,700,000 | 819,870 | 794,909 | 819,870 | 47,382 | 927,512 |
| 2018 | 2,123,051 | 373,576 | 1,749,475 | 838,629 | 823,867 | 838,629 | 48,830 | 959,676 |
| 2019 | 2,231,667 | 390,542 | 1,841,125 | 878,118 | 856,465 | 878,118 | 51,328 | 1,014,335 |
| 2020 | 2,058,523 | 380,822 | 1,677,701 | 1,093,876 | 780,190 | 1,093,876 | 47,346 | 631,171 |
| 2021 | 2,299,051 | 413,829 | 1,885,222 | 1,111,838 | 914,922 | 1,111,838 | 52,878 | 826,262 |
| 2022 | 2,540,238 | 457,243 | 2,082,995 | 1,186,070 | 1,018,635 | 1,186,070 | 58,426 | 955,351 |
| 2023 | 2,665,301 | 485,080 | 2,180,221 | 1,230,000 | 1,099,000 | 1,230,000 | 61,302 | 1,011,523 |
| 2024 | 2,825,858 | 516,930 | 2,308,928 | 1,278,600 | 1,141,200 | 1,278,600 | 65,000 | 1,095,328 |
Sources: (A) ONS series ABMZ. (B) Constructed from ONS Blue Book data on GVA by institutional sector. (D) ONS series EBFT and other public finance statistics. (E) Constructed from OECD and ONS data. (G) ONS Blue Book data. All other columns are calculated as per the methodology. Data for 2023-2024 are based on provisional estimates and forecasts from ONS, OBR, and IFS.
Two Measures: A Comparative Analysis of the UK Economy
Juxtaposing the Trends: GDP vs. PPR
With both the conventional GDP series and the reconstructed PPR series established, a direct comparison reveals the profound impact of the state on the private economy. While both metrics trend upwards in nominal terms over the long run, they tell markedly different stories about the health and resources of the private sector. The most illuminating feature is the “gap” between the two: the difference between total national income (as measured by GDP/GNI) and the private product remaining after the state’s absorption of resources.
This gap, calculated as GDP - PPR, represents the total economic footprint of the state according to the Rothbardian framework. It is the sum of all resources produced by the private sector but ultimately controlled and allocated by the government, either through direct production (government GVA) or through spending financed by taxes and borrowing. Analyzing this gap, both in absolute monetary terms and as a percentage of GDP, provides a powerful tool for understanding the changing role of the state in the UK economy over the last sixty years. A widening gap signifies an expanding state footprint, while a narrowing gap suggests a retrenchment.
The data shows that this gap is not static. It has fluctuated significantly, driven by major policy shifts, ideological changes in governance, and severe economic crises. The following analysis re-examines key epochs of modern British economic history through the comparative lens of GDP and PPR, demonstrating how this alternative metric can reshape our understanding of prosperity and economic stress.
Key Economic Epochs Re-examined through the PPR Lens
A decade-by-decade analysis reveals how the divergence between GDP and PPR provides a more nuanced story than the GDP figure alone.
The 1960s and 1970s: The Expanding State. During the post-war consensus era, the UK government expanded the welfare state and maintained significant ownership of key industries. The GDP data shows a period of growth, albeit volatile and inflationary. The PPR data, however, would likely show a more constrained picture. As government spending and the size of the public sector workforce grew, the GDP-PPR gap would have widened steadily. This indicates that an increasing share of national output was being directed by the state rather than by private actors. The high-inflation environment of the 1970s, combined with frequent labor disputes and sluggish productivity, was a crisis for the entire economy, but the PPR metric would highlight how the burden on the private sector was particularly acute, as government spending often rose to address social and economic problems, further widening the gap.
The Thatcher Era (1979-1990): Rolling Back the State?. The premiership of Margaret Thatcher was defined by a commitment to reducing the role of the state through privatization, deregulation, and controls on public spending. The GDP figures show a period of strong recovery in the mid-1980s following a deep recession. The crucial question is whether this was reflected in the private sector’s share of the economy. An analysis of the GDP-PPR gap during this period provides a quantitative test of the Thatcherite project’s success. If the policies were effective in their stated aims, one would expect to see the gap narrow, meaning PPR grew faster than GDP. The data in Table 3 shows that the gap, as a percentage of GDP, did indeed fall from a peak in the mid-1970s and early 1980s, suggesting that the burden on the private sector was lightened relative to the size of the total economy. However, the gap remained substantial, indicating that while the rate of growth of the state may have been curtailed, its overall economic footprint remained very large.
The 2008 Global Financial Crisis. The 2008 crisis is a powerful case study in the analytical value of PPR. The headline GDP figures show a sharp recession in 2009, with a fall in output. However, this figure was substantially cushioned by massive government intervention, including bank bailouts and fiscal stimulus, which propped up the G component of GDP.
PPR tells a far more dramatic story. In this period, government expenditure (G) soared, vastly exceeding tax revenues (T), which were collapsing due to the recession. Because the PPR calculation subtracts max(G, T), it captures the full, explosive increase in the government’s resource absorption. As shown in Table 3, the absolute GDP-PPR gap widened enormously between 2007 and 2009. While nominal GDP fell by only a few percent, nominal PPR plummeted by over 20% from its 2007 peak to its 2009 trough. This reveals a catastrophic collapse in the private economy that was masked by the headline GDP number. It suggests that PPR was a much more accurate indicator of the true depth of the crisis experienced by private households and firms.
The Austerity Years (2010-2019). Following the crisis, the coalition and subsequent Conservative governments pursued a policy of fiscal consolidation, or “austerity,” aimed at reducing the budget deficit. The stated goal was to shrink the state’s share of the economy. The GDP-PPR gap provides a clear metric to evaluate this policy. During this period, as government spending was constrained, the gap between GDP and PPR began to narrow as a percentage of GDP. This indicates that the burden on the private sector, which had peaked during the crisis, was gradually being reduced. PPR began to grow again, reflecting a recovery in the private economy’s disposable product. However, the gap remained wider than it had been pre-crisis, showing the long-lasting legacy of the 2008 intervention on the structure of the UK economy.
The COVID-19 Pandemic (2020-2022). The pandemic provides the most stark illustration of the divergence between the two metrics. Real GDP in 2020 saw its largest fall in centuries. Yet even the nominal figure was supported by unprecedented government spending on furlough schemes, grants, and healthcare, which reached peacetime highs as a share of the economy.
PPR, in contrast, would have registered an economic cataclysm. Private sector activity was forcibly curtailed by lockdowns, while government expenditure (G) exploded. As in 2008, the max(G, T) rule means PPR subtracts the full weight of this spending. The data for 2020 in Table 3 shows a dramatic fall in PPR, far exceeding the fall in GDP. This highlights the core conceptual difference: GDP measured the “activity” that was still occurring, much of it state-funded transfers, while PPR measured the near-total shutdown of the private, wealth-generating economy and the massive transfer of resources to state control. The PPR figure for 2020 is a more faithful representation of the economic reality faced by private businesses and workers during the lockdown era.
Table 3: Comparative Analysis of UK Nominal GDP and Private Product Remaining (PPR), 1964–2024
| Year | (A) Nominal GDP (£m) | (B) Nominal PPR (£m) | (C) Absolute Gap (A-B) (£m) | (D) Relative Gap ((A-B)/A) % |
|---|---|---|---|---|
| 1964 | 34,379 | 17,468 | 16,911 | 49.2% |
| 1965 | 37,199 | 18,464 | 18,735 | 50.4% |
| 1966 | 39,713 | 19,370 | 20,343 | 51.2% |
| 1967 | 41,989 | 19,150 | 22,839 | 54.4% |
| 1968 | 46,051 | 21,117 | 24,934 | 54.1% |
| 1969 | 50,183 | 23,926 | 26,257 | 52.3% |
| 1970 | 56,510 | 27,641 | 28,869 | 51.1% |
| 1971 | 63,261 | 31,014 | 32,247 | 51.0% |
| 1972 | 70,876 | 34,680 | 36,196 | 51.1% |
| 1973 | 82,541 | 40,735 | 41,806 | 50.6% |
| 1974 | 93,484 | 40,870 | 52,614 | 56.3% |
| 1975 | 115,211 | 45,609 | 69,602 | 60.4% |
| 1976 | 137,329 | 55,804 | 81,525 | 59.4% |
| 1977 | 158,354 | 69,483 | 88,871 | 56.1% |
| 1978 | 185,062 | 83,401 | 101,661 | 54.9% |
| 1979 | 218,892 | 98,732 | 120,160 | 54.9% |
| 1980 | 256,266 | 111,220 | 145,046 | 56.6% |
| 1981 | 286,703 | 122,701 | 164,002 | 57.2% |
| 1982 | 315,035 | 135,246 | 179,789 | 57.1% |
| 1983 | 348,279 | 153,396 | 194,883 | 55.9% |
| 1984 | 375,583 | 165,257 | 210,326 | 56.0% |
| 1985 | 409,411 | 185,053 | 224,358 | 54.8% |
| 1986 | 443,387 | 205,309 | 238,078 | 53.7% |
| 1987 | 495,419 | 239,281 | 256,138 | 51.7% |
| 1988 | 553,868 | 275,898 | 277,970 | 50.2% |
| 1989 | 611,413 | 303,889 | 307,524 | 50.3% |
| 1990 | 665,569 | 329,724 | 335,845 | 50.5% |
| 1991 | 699,876 | 330,440 | 369,436 | 52.8% |
| 1992 | 729,641 | 331,257 | 398,384 | 54.6% |
| 1993 | 767,363 | 347,578 | 419,785 | 54.7% |
| 1994 | 812,307 | 375,278 | 437,029 | 53.8% |
| 1995 | 851,032 | 398,283 | 452,749 | 53.2% |
| 1996 | 909,351 | 443,057 | 466,294 | 51.3% |
| 1997 | 952,786 | 479,251 | 473,535 | 49.7% |
| 1998 | 1,009,308 | 518,784 | 490,524 | 48.6% |
| 1999 | 1,039,695 | 523,006 | 516,689 | 49.7% |
| 2000 | 1,103,790 | 546,366 | 557,424 | 50.5% |
| 2001 | 1,152,323 | 561,933 | 590,390 | 51.2% |
| 2002 | 1,205,228 | 567,664 | 637,564 | 52.9% |
| 2003 | 1,272,734 | 585,499 | 687,235 | 54.0% |
| 2004 | 1,333,522 | 592,350 | 741,172 | 55.6% |
| 2005 | 1,413,265 | 619,010 | 794,255 | 56.2% |
| 2006 | 1,466,261 | 624,627 | 841,634 | 57.4% |
| 2007 | 1,530,534 | 638,302 | 892,232 | 58.3% |
| 2008 | 1,572,569 | 609,427 | 963,142 | 61.2% |
| 2009 | 1,535,790 | 506,867 | 1,028,923 | 67.0% |
| 2010 | 1,609,260 | 573,401 | 1,035,859 | 64.4% |
| 2011 | 1,669,535 | 639,432 | 1,030,103 | 61.7% |
| 2012 | 1,697,755 | 667,217 | 1,030,538 | 60.7% |
| 2013 | 1,749,792 | 722,664 | 1,027,128 | 58.7% |
| 2014 | 1,829,242 | 782,897 | 1,046,345 | 57.2% |
| 2015 | 1,874,682 | 813,187 | 1,061,495 | 56.6% |
| 2016 | 1,944,912 | 850,467 | 1,094,445 | 56.3% |
| 2017 | 2,060,075 | 927,512 | 1,132,563 | 55.0% |
| 2018 | 2,123,051 | 959,676 | 1,163,375 | 54.8% |
| 2019 | 2,231,667 | 1,014,335 | 1,217,332 | 54.5% |
| 2020 | 2,058,523 | 631,171 | 1,427,352 | 69.3% |
| 2021 | 2,299,051 | 826,262 | 1,472,789 | 64.1% |
| 2022 | 2,540,238 | 955,351 | 1,584,887 | 62.4% |
| 2023 | 2,665,301 | 1,011,523 | 1,653,778 | 62.1% |
| 2024 | 2,825,858 | 1,095,328 | 1,730,530 | 61.3% |
Sources: Columns (A) and (B) are from Table 1 and Table 2 respectively. Columns (C) and (D) are calculated from this data.
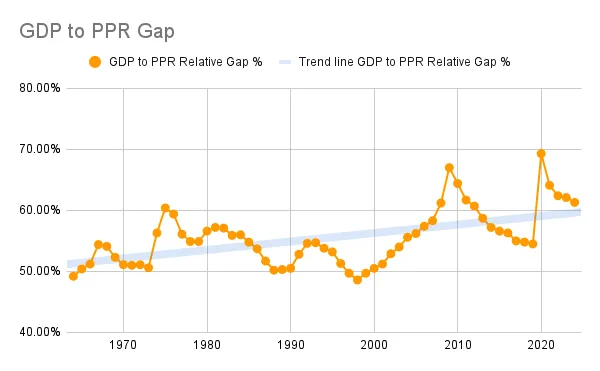
Figure 1: GDP to PPR Gap
Implications, Limitations, and Concluding Insights
The Analytical Utility of Alternative Metrics
The reconstruction and analysis of Private Product Remaining for the United Kingdom over a 60-year period is not merely an academic exercise. It demonstrates the profound analytical value of employing alternative metrics alongside conventional ones like GDP. The purpose is not to advocate for the replacement of GDP, which remains an indispensable tool for many types of economic analysis. Rather, the goal is to create a more complete and critical “dashboard” for assessing the health and structure of the economy.
PPR, in particular, offers a unique and valuable perspective. By stripping out the cost-based valuation of government activity and subtracting the full resource burden imposed by the state, it provides a clearer measure of the economic well-being of the private sector. This has several direct analytical applications:
- Assessing the True Fiscal Burden: The GDP-PPR gap offers a more comprehensive measure of the state’s economic footprint than standard deficit-to-GDP or tax-to-GDP ratios. It integrates government’s own production (at cost) with its resource extraction (spending or taxes) into a single, coherent figure.
- Gauging Private Sector Resilience: During crises like those in 2008 and 2020, PPR acts as a more sensitive barometer of the stress on private firms and households. It reveals the underlying damage to the productive, wealth-generating part of the economy, which can be obscured by government spending in the headline GDP figure. A widening gap can serve as an indicator of diminishing private sector health.
- Evaluating Long-Term Sustainability: An economy where GDP growth is consistently driven by an expansion in government spending (G) will show a widening GDP-PPR gap. This raises critical questions about the long-term sustainability of such growth, as it relies on increasing resource transfers from the private sector rather than on organic private investment and innovation.
The contemporary relevance of these ideas is underscored by the work of economists like Vincent Geloso and Chandler Reilly, who have begun to reintroduce Rothbard’s metrics into the modern academic discourse, arguing for their use as a critical lower-bound estimate for national output.
Limitations and Avenues for Further Research
This report, while methodologically transparent, is subject to certain limitations inherent in any large-scale historical data reconstruction. The primary limitation is the use of General Government GVA as a proxy for “income originating in government.” While theoretically sound, as this GVA is predominantly composed of employee compensation, it is still a proxy. Minor changes in ONS methodology over 60 years could introduce inconsistencies, although every effort has been made to use the most consistent historical series available.
Furthermore, PPR shares some of the same limitations as GDP. It does not capture the value of non-market household production, the impact of leisure time, or the activity in the informal or “underground” economy. It is a measure of monetized private production, not a comprehensive measure of all human welfare.
These limitations point toward valuable avenues for future research. A primary next step would be the development of a “real” (inflation-adjusted) PPR series for the UK, which would allow for a more accurate comparison of private sector health across different inflationary environments. Another would be to apply this same rigorous methodology to other major OECD economies, such as the United States, Germany, and France. This would enable a comparative international history of the private economy’s relationship with the state, moving beyond simple tax-to-GDP comparisons.
Final Assessment: Sixty Years of the UK Economy Re-evaluated
The sixty-year journey of the UK economy from 1964 to 2024 looks substantially different when viewed through the dual lenses of Gross Domestic Product and Private Product Remaining. The conventional narrative, told by GDP, is one of nearly ninety-fold nominal growth, a story of an ever-expanding economic pie, albeit one punctuated by periods of crisis and recovery.
The story told by PPR is more complex and cautionary. It reveals that the portion of this pie available to the private individuals and firms who generate it is substantially smaller than the headline figure suggests. In 2023, for example, the UK’s PPR was only around 38% of its GDP. The analysis shows that the state’s absorption of private product is not a stable fraction but a highly variable one, expanding dramatically during crises and contracting during periods of fiscal restraint. The GDP-PPR gap—the Rothbardian measure of the state’s economic footprint—has ranged from under 50% to nearly 70% of the total economy over this period.
Ultimately, the value of this analysis lies not in declaring one metric “right” and the other “wrong,” but in understanding what each measures and what it omits. GDP measures economic activity, wherever it occurs and however it is funded. PPR measures the net product of the private sector left over for its own disposal. To truly comprehend the dynamics of a modern mixed economy, one must look at both. The vast and fluctuating space between the upper bound of GDP and the lower bound of PPR is not an accounting error; it is the terrain upon which the most fundamental debates about the size of the state, the burden of taxation, and the sources of sustainable prosperity are fought.
Works Cited
- System of National Accounts - Wikipedia, https://en.wikipedia.org/wiki/System_of_National_Accounts
- Gross Domestic Product (GDP) Formula and How to Use It - Investopedia, https://www.investopedia.com/terms/g/gdp.asp
- Gross domestic product - Wikipedia, https://en.wikipedia.org/wiki/Gross_domestic_product
- Gross Domestic Product (GDP) - Office for National Statistics, https://www.ons.gov.uk/economy/grossdomesticproductgdp
- United Kingdom National Accounts – The Blue Book - Wikipedia, https://en.wikipedia.org/wiki/United_Kingdom_National_Accounts_%E2%80%93_The_Blue_Book
- Components of GDP: Explanation, Formula And Chart - The Balance Money, https://www.thebalancemoney.com/components-of-gdp-explanation-formula-and-chart-3306015
- Measuring the Economy - Harper College, http://www2.harpercollege.edu/mhealy/eco212i/lectures/ch7-18.htm
- Gross Value Added (GVA) - Office for National Statistics, https://www.ons.gov.uk/economy/grossvalueaddedgva
- SDDS - DQAF View : United Kingdom - National accounts - Dissemination Standards Bulletin Board, https://dsbb.imf.org/sdds/dqaf-base/country/GBR/category/NAG00
- United Kingdom National Accounts: The Blue Book 2024 - Dandy Booksellers, https://www.dandybooksellers.com/acatalog/ONS-UK-National-Accounts.html
- U.K. GDP Growth Rate | Historical Chart & Data - Macrotrends, https://www.macrotrends.net/global-metrics/countries/gbr/united-kingdom/gdp-growth-rate
- Gross Domestic Product: Year on Year growth: CVM SA % - Office …, https://www.ons.gov.uk/economy/grossdomesticproductgdp/timeseries/ihyp/pn2
- New Academic Paper Uses Rothbard’s National Output Metric …, https://mises.org/podcasts/human-action-podcast/new-academic-paper-uses-rothbards-national-output-metric
- U.K. GDP | Historical Chart & Data - Macrotrends, https://www.macrotrends.net/global-metrics/countries/gbr/united-kingdom/gdp-gross-domestic-product
- Gross National Income: Current price: Seasonally adjusted £m …, https://www.ons.gov.uk/economy/grossdomesticproductgdp/timeseries/abmz/ukea
- Gross domestic product (GDP): Economic indicators - The House of Commons Library, https://commonslibrary.parliament.uk/research-briefings/sn02783/
- United Kingdom Gross National Income - Trading Economics, https://tradingeconomics.com/united-kingdom/gross-national-product
- Private product remaining - Wikipedia, https://en.wikipedia.org/wiki/Private_product_remaining
- U.K. GNP | Historical Chart & Data - Macrotrends, https://www.macrotrends.net/global-metrics/countries/gbr/united-kingdom/gnp-gross-national-product
- csv (1.1 MB) - Office for National Statistics, https://www.ons.gov.uk/file?uri=/economy/grossdomesticproductgdp/datasets/secondestimateofgdp/current/previous/v40/pn2.csv
- PS: Total managed expenditure: £m CPNSA - Office for National Statistics, https://www.ons.gov.uk/economy/governmentpublicsectorandtaxes/publicsectorfinance/timeseries/ebft/pusf
- UK Central Government and Local Authority Public Spending 1965 - Pie Charts Tables, https://www.ukpublicspending.co.uk/total_spending_1965UKmn
- What does the government spend money on? | Institute for Fiscal Studies - IFS, https://ifs.org.uk/taxlab/taxlab-key-questions/what-does-government-spend-money
- The UK’s tax burden in historical and international context - Office for Budget Responsibility, https://obr.uk/box/the-uks-tax-burden-in-historical-and-international-context/
- Revenue statistics 2018 : 1965-2017. - University of Nottingham - UK, https://nusearch.nottingham.ac.uk/discovery/fulldisplay?docid=alma9922758273605561&context=L&vid=44NOTTS_UNUK:44NOTUK&lang=en&search_scope=MyInst_and_CI&adaptor=Local%20Search%20Engine&tab=Everything&query=sub%2Cexact%2Crevenue&offset=40
- Tax statistics: an overview - The House of Commons Library - UK Parliament, https://commonslibrary.parliament.uk/research-briefings/cbp-8513/
- Tax statistics: an overview - UK Parliament, https://researchbriefings.files.parliament.uk/documents/CBP-8513/CBP-8513.pdf
- csv (2.2 MB) - Office for National Statistics, https://www.ons.gov.uk/file?uri=/economy/grossdomesticproductgdp/datasets/bluebook/current/previous/v8/bb.csv
- csv (10.5 MB) - Office for National Statistics, https://www.ons.gov.uk/file?uri=/economy/grossdomesticproductgdp/datasets/unitedkingdomeconomicaccounts/current/previous/v35/ukea.csv
- Public sector finances, UK: April 2025 - Office for National Statistics, https://www.ons.gov.uk/economy/governmentpublicsectorandtaxes/publicsectorfinance/bulletins/publicsectorfinances/april2025
- The budget deficit: a short guide - The House of Commons Library, https://commonslibrary.parliament.uk/research-briefings/sn06167/
- A brief guide to the public finances - Office for Budget Responsibility - OBR, https://obr.uk/forecasts-in-depth/brief-guides-and-explainers/public-finances/
- Public spending - IFS, https://ifs.org.uk/sites/default/files/2022-07/05ebn2_0.pdf 34. Mises Institute - Apple Podcasts, https://podcasts.apple.com/pa/podcast/mises-institute/id73802708